Report progress with BIM-native precision.

Track physical and economic progress against the Work Breakdown Structure — 4D models, S-curves and monthly reports from one source of truth.

Project Demo Project
EN
Project Reports
Reports
Status
Actions
Recent Reports
June 2026
Submitted
May 2026
Submitted
April 2026
Submitted
Previous Reports
March 2026
Submitted
February 2026
Submitted
January 2026
Submitted
December 2025
Submitted
November 2025
Submitted
October 2025
Submitted
September 2025
Submitted
Group
July 2026
Total Progress
Contractual Value
Histogram
(Total)
12,668.230.06%
7,521,294.9437.18%
20,229,620.14
PRJ – PRJ
12,668.230.06%
7,029,546.2935.62%
19,737,871.49
CTR-01 – CTR-01
12,668.230.17%
5,178,556.1770.00%
7,397,937.39
CTR-02 – CTR-02
0.000.00%
1,850,990.1215.00%
12,339,934.10
V01 – Variant 1
0.000.00%
29,958.59100.00%
29,958.59
CTR-01 – CTR-01
0.000.00%
29,958.59100.00%
29,958.59
V03 – Variant 3
0.000.00%
461,790.06100.00%
461,790.06
CTR-02 – CTR-02
0.000.00%
461,790.06100.00%
461,790.06
Settings
WBS1 (Project ID)
WBS2 (Contract)
WBS3 (Building)
WBS4 (Level)
WBS5 (Project Category)
WBS6 (Zone)
WBS7 (Category of Work)
Group by
WBS1 (Project ID)
WBS2 (Contract)
S-Curve
2026
€0€300K€600K€900K€1.2M€1.5M€0€1M€2M€3M€4M€5M€6M€7M€8MRevenueCumulative1.25M1.45M1.33M1.28M1.3M764.11K12.67K00000
May
Actual Revenue€1,300,216.91
Cumulative Actual Revenue€6,606,398.93
Title
January
February
March
April
May
June
July
August
September
October
November
December
Actual Cost
€1.25M
€1.45M
€1.33M
€1.28M
€1.3M
€764.11K
€12.67K
€0
€0
€0
€0
€0
Cumulative Actual Cost
€1.25M
€2.7M
€4.03M
€5.31M
€6.61M
€7.37M
€7.38M
€7.38M
€7.38M
€7.38M
€7.38M
€7.38M
ProgressingPaused
Group
July 2026
Total Progress
Contractual Value
Actions
(Total)
0.000.00%2,164,377.4050.29%
1,936,627.1045.00%2,164,377.4050.29%
4,303,615.77
Building 42
0.000.00%1,355,851.8662.50%
1,128,101.5652.00%1,355,851.8662.50%
2,169,426.08
Level 00
0.000.00%512,438.1890.00%
284,687.8850.00%512,438.1890.00%
569,375.75
Structure
0.000.00%512,438.1890.00%
284,687.8850.00%512,438.1890.00%
569,375.75
Zone B3
0.000.00%512,438.1890.00%
284,687.8850.00%512,438.1890.00%
569,375.75
Concrete hollow deck
0.000.00%512,438.1890.00%
284,687.8850.00%512,438.1890.00%
569,375.75
0.000.000.00%512,438.18685.7690.00%0.000.000.00
284,687.88380.9850.00%512,438.18685.7690.00%
569,375.75761.95
WBS2 (Contract)
Monthly Report

One report. Every signal, in orbit.

Financials, risks, progress, quality and safety — the whole Monthly Cost Control Report, orbiting a single governed source of truth.

Approve report
Skyline Tower
Monthly Report 62
MonthlySubmitted01/01/2025 – 31/01/2025
Portfolio earned value
€0m€0m€3m€25m€6m€50m€9m€75m€12m€100m€15m€125m€18m€150mRevenueCumulative8,2m9,2mJan9m10mFeb8,8m9,8mMar10,1m10,1mApr12,8m11,8mMay15m13mJun13,3m12,3mJul14m13mAug14m16mSep13,2m15,2mOct13,6m12,6mNov9m8mDec
Cashflow
€100,000€50,000€0,00€9m€50,000€100,000€200,000€175m€150m€125m€100m€75m€50m€25m€0mValueCumulativeJanFebMarAprMayJunJulAugSepOctNovDec
Risk matrix
Probability
ThreatsOpportunities
Very high532
High2271
Medium432
Low4371
Very low12
Very highHighMediumLowVery lowVery highHighMediumLowVery low
Impact
Man power destribution
Manpower across portfolio
05010015020025050Jan100Feb100Mar150Apr150May180Jun100Jul170Jul200Jul
DH3 – As built / Finish
02004006008001000JanMarMayJulSepNov5.0%90%5.0%Active usersMonth
Ongoing business overview
€ 23,257.000 /70,250,400
2.6% +€10,350,064 increased in 2024
€ 23,257.000Oct€ 23,257.000Nov€ 23,257.000Dec (Planned)
Project 1Project 2Project 3Project 4Project 5
Always current

Every report tied to the model.

NeuroBuild measures physical and economic progress straight against the 4D model and the Work Breakdown Structure — so every monthly report reflects what was actually built, not what was assumed.

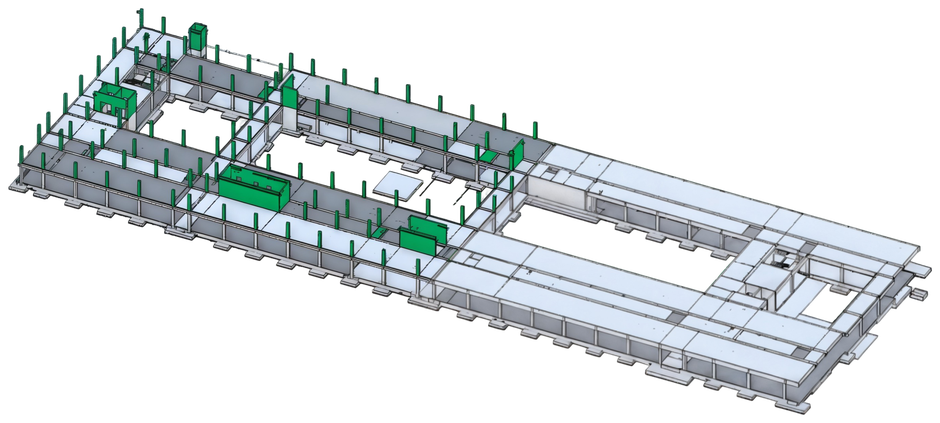
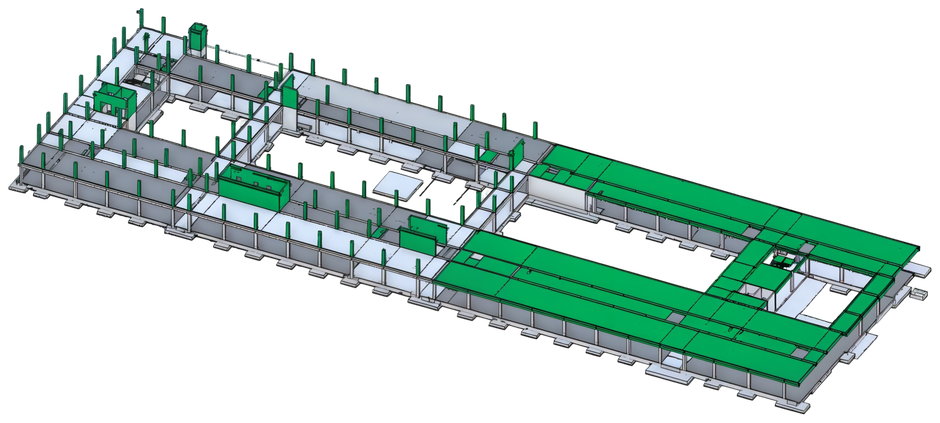
Measured on the 4D model

Progress is read from the model itself — each element, each zone, each level — not from a spreadsheet guess.

Physical and economic

Track completion percentage and earned value side by side. S-curves compare planned against actual at a glance.

Reports in one click

Publish a governed monthly report from a single source of truth — consistent every period, ready for the client.

No more surprises

See Progress Reporting on your projects

Start with a guided pilot on your own data.

Book a Demo →