A predictive QA/QC system architecture continuously monitors construction quality using sensors and analytics, rather than relying solely on periodic manual checks. In heavy civil projects (roads, bridges, dams, etc.), this system collects real-time data (e.g. from laser scanners, strain gauges, GPS tags) and applies analytics to forecast defects or deviations. By automating inspection and data capture, teams catch issues early, reducing costly rework and labor. Such systems make QA/QC proactive and data-driven – improving inspection accuracy and streamlining workflows. In short, a predictive QA/QC architecture transforms quality assurance into a continuous, integrated process that enhances safety and project outcomes.
Table of Contents
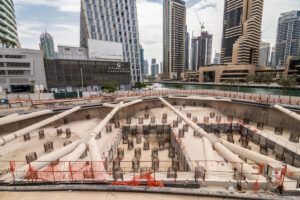
Operating Environment & Site Constraints
In practice, a predictive QA/QC system must function across large, rugged job sites. Sensors and devices endure harsh conditions (extreme weather, dust, vibration) and may rely on battery or solar power. Connectivity (cellular, Wi-Fi, LPWAN or even satellite) spans remote areas to transmit data. These systems integrate with existing project infrastructure (e.g. BIM, GIS, or SCADA) and must align with construction schedules and safety protocols. Performance expectations include high reliability and low latency for critical alerts.
For example, modern IoT platforms use secure cloud setups to process sensor data into large datasets and visualizations, ensuring assets work optimally while reducing risk. An open-architecture design is common: platforms allow easy integration of diverse IoT devices without vendor lock-in. In summary, a predictive QA/QC system operates under demanding field constraints but leverages cloud and mobile technologies to unify scattered site data into a coherent quality-monitoring environment.
Suggested article to read: 5 Use Cases of IoT‑Enabled Concrete Monitoring in Commercial Construction

Core Components of a Predictive QA/QC System Architecture
-
Sensing and Data Acquisition: A variety of smart sensors and devices capture quality-related parameters. Examples include vibration or strain gauges on structures, temperature/humidity sensors for material conditions, LIDAR or photogrammetry units for geometry, RFID/GPS trackers for material location, and non-destructive testing (ultrasonic, infrared) for hidden defects. These devices continuously feed digital measurements into the system.
-
Edge/On-Site Hardware: Gateways, PLCs or edge computers aggregate and preprocess raw sensor streams. They handle local filtering (e.g. averaging or thresholding) and time-synchronization before sending data on.
-
Communications Network: A combination of wired and wireless links (Ethernet, Wi-Fi, cellular/5G, LoRaWAN, satellite) transfers data from the job site to central servers. Network choice balances range, bandwidth, and power consumption. For instance, solar-powered LoRaWAN nodes may report occasional readings, while 5G-enabled cameras stream video for visual QA.
-
Cloud/Processing Layer: A cloud platform or on-premise server farm stores incoming data. This layer includes databases, message queues and processing logic. Big Data and mobile-ICT platforms in construction aggregate diverse inputs (point clouds, images, sensor logs) to support predictive QA/QC through comprehensive analysis. Data pipelines often use industry-standard protocols (MQTT, OPC-UA) and APIs to integrate with ERP/BIM systems.
-
Analytics & Decision Engine: Advanced analytics run on the collected data. This includes simple rule-based checks (e.g. “temperature exceeded specification”) and machine-learning models that detect anomalies or predict failures. For example, time-series analysis might flag accelerating soil displacement as a slip risk. These engines apply predefined thresholds or learned criteria to generate quality alerts.
-
User Interface & APIs: Project dashboards, mobile apps, or SCADA consoles visualize current status and alerts. They provide charts, heatmaps, and 3D overlays on BIM models to highlight defect trends. APIs allow integration with project management software, enabling automated workflows (e.g. opening a work order when a defect is detected).
| Sensor Type / Data | Measures | Typical Use Case |
|---|---|---|
| Vibration / Strain | Dynamic loads, material stress | Detect foundation settling or beam overstress |
| Temperature / Humidity | Environmental conditions | Ensure proper concrete curing or material integrity |
| LIDAR / Photogrammetry | Geometry, dimensions | Verify as-built alignments and detect structural shifts |
| Positioning (GPS/GNSS) | Location, elevation | Track tunnel/road alignment and equipment placement |
| Ultrasonic / IR Imaging | Internal defects, cracks | Non-destructive testing of welds, pipes, or concrete slabs |
How the Technology Works (Deep Technical Flow)
-
Sensing & Data Capture: Sensors sample conditions continuously or at regular intervals. For instance, strain gauges output electrical signals proportional to load, and drones or robotic scanners capture images of finished segments. Data formats vary (binary, time series, images), but each reading is time-stamped.
-
Local Processing & Transmission: Edge devices (gateways) receive raw signals, apply initial filtering (e.g. noise reduction) and convert them into standardized digital messages. These are then encrypted and sent over the chosen network to the central platform. Communication may be asynchronous: critical alerts use real-time streams, while routine logs batch-upload via 4G/5G or other links.
-
Ingestion & Storage: Incoming data flows into a cloud IoT platform. A message broker queues the data, which is then persisted in databases or data lakes. Data is often tagged by location and integrated with project models (e.g. associating a sensor reading with a specific bridge pier in the BIM model). Time synchronization ensures readings from different sources align.
-
Analytics & Anomaly Detection: The system applies analytics in stages. First, rule engines check absolute thresholds (e.g. tensile strength below spec). Concurrently, ML algorithms (trained on historical project data) run anomaly detection on time-series or image data. For example, an ML model might learn normal vibration patterns and flag unusual spikes. These pipelines may run in real-time or in short batch jobs. High data throughput (e.g. dense laser scans) requires scalable computing; in one study TLS scans cut on-site inspection time by 60% but shifted workload to heavy post-processing.
-
Decision Logic & Alerts: When analysis identifies a potential quality issue (exceeding a threshold, mismatch with design, or ML anomaly), it triggers alerts. The logic can be simple (if Δ > threshold) or contextual (cross-referencing multiple sensors). Alerts propagate to engineers and supervisors via notifications (SMS, email, app alerts). For example, a machine-learning warning system may automatically notify QA teams when concrete strength or alignment drifts towards unacceptable levels.
-
Feedback & Reporting: Stakeholders review dashboards that show current measurements against tolerances and historical trends. The system generates daily or real-time reports, and can even integrate with control systems (e.g. halting an installation if a critical defect is detected). Over time, collected data helps refine the predictive models and informs project adjustments.
Performance Factors, Thresholds & Limitations
-
Sensor Accuracy vs. Environment: Each sensor has inherent precision (e.g. a laser scanner may resolve millimeters). Environmental factors (temperature swings, moisture, vibrations) introduce noise or drift. Teams must calibrate sensors and account for these effects. For instance, one TLS study showed sub-millimeter alignment detection but noted that post-scan data processing remained computation-intensive. High humidity or dust may impair optical sensors, requiring redundant measurements.
-
Data Quality & Latency: Wireless links introduce delays and potential data loss. In a real construction site, network congestion or outages can gap the data. Critical checks (like structural safety) must consider worst-case latency: a cloud round-trip may take seconds. Edge computing mitigates this by handling immediate thresholds locally.
-
Analytic Limits: The predictive algorithms have false positives/negatives. Thresholds must balance sensitivity (catching true defects) against noise. Machine learning models depend on quality training data; rare failure modes may be missed if not seen before. Consequently, system accuracy is limited by both sensor precision and the robustness of data models.
-
Interoperability & Standards: Integrating many IoT devices can be challenging. Different vendors use different protocols, so middleware or adapters are needed. As noted in industry reviews, data processing complexity and interoperability issues are significant barriers to adoption. Ensuring consistent data formats (e.g. industry standards for construction QA) is a key focus.
-
Scalability & Cost: Large-scale deployments (hundreds of sensors) must handle big data volumes. Cloud infrastructure scales well, but compute costs rise. There is a trade-off: more frequent sampling yields finer detection but higher processing load and possibly reduced battery life.
-
Security & Edge Cases: While not solely a performance factor, system security (encrypting IoT data, authentication) is critical to prevent tampering. Edge-case behavior (sensor failures, extreme weather) must be handled by fallback procedures (e.g. switching to manual inspection if sensors go offline).
Use Cases in Heavy Infrastructure and Capital Projects
-
Highway and Roadworks: During asphalt paving, accelerometers or deflection gauges on rollers feed compaction data. The QA/QC system predicts under-compaction zones, prompting immediate re-rolls. LIDAR scanners verify road elevation and detect rutting early. Continuous monitoring in this scenario allows crews to correct errors on the fly, instead of waiting for a post-construction survey.
-
Bridge Construction: In a bridge erection, tiltmeters and load cells on girders measure angle and tension. The predictive system compares these in real time against the design model. If a cable stays too slack or a support lifts beyond tolerance, the system flags the issue. A similar approach was used on a bridge rehabilitation project, where real-time IoT data enabled proactive safety and time savings.
-
Dam or Water Infrastructure: For a dam under construction, embedded moisture and strain sensors monitor concrete curing and foundation stability. The QA/QC platform uses these readings to forecast crack risks. For example, if temperature sensors show uneven curing, the system alerts engineers to adjust cooling measures before integrity is compromised. Continuous geotechnical monitoring of levees or embankments can likewise predict seepage or slope failure.
-
Industrial Prefabrication: In a precast concrete plant (industrial setting), 3D laser scanners and thermal cameras inspect each panel. The predictive QA/QC system compares scans against BIM models to detect geometric deviations or internal voids. Any anomalies (e.g. an air pocket in a wall) are identified before panels leave the factory, ensuring consistent quality across buildings. This same approach applies to modular steel frame assembly or machine installations.
Manual vs. Automated QA/QC: A Comparison
| Aspect | Traditional (Manual) | Predictive Automated System |
|---|---|---|
| Data Collection | Periodic site walks with checklists | Continuous sensor and scan-based sensing |
| Response Time | Reactive (errors found days/weeks later) | Near real-time alerts and corrections |
| Accuracy | Variable (subject to human error) | High (precise instrumentation) |
| Data Integration | Fragmented (spreadsheets, paper forms) | Unified digital platform (dashboards) |
| Decision Support | Experience-based judgments | Data-driven analytics and dashboards |
| Rework & Costs | Higher rework rates due to late detection | Reduced rework (issues caught early) |
| Documentation | Manual logs (paper, PDFs) | Automated logging, traceable audit trail |
Implementation Considerations for Technical Teams
-
Integration Steps: Begin by connecting sensors to the network and ensuring interoperability. Use standardized communication protocols to link devices and data. Integrate the QA/QC platform with project BIM/GIS so that every data point maps to a physical location. During setup, synchronize clocks on all devices to ensure consistent timestamps. As one best practice, deploy a unified digital platform so that QA/QC data from all sources feeds into one system.
-
Configuration & Calibration: Calibrate sensors before use and define measurement tolerances in the system. Establish threshold values and feed initial design/specification data into the analytics engine. In machine-learning scenarios, provide baseline datasets from normal operations to train anomaly detectors.

-
Common Pitfalls: Avoid leaving sensors unmonitored (dead batteries or disconnected). Plan for fallback if connectivity fails (e.g. local data buffering). Ensure field staff are trained on basic troubleshooting. A common mistake is neglecting cybersecurity – always encrypt IoT data in transit and enforce access controls on the platform.
-
Security Considerations: Protect the system with encryption (TLS/SSL) and secure authentication. For critical infrastructure, consider network segmentation so QA/QC devices are isolated from general IT networks. Periodically update firmware on IoT devices to patch vulnerabilities.
-
Data Governance: Define who owns and has access to the data. Implement data retention and backup policies. Ensure regulatory compliance (especially for public infrastructure) by keeping a verifiable log of inspections and any quality overrides.
-
Team Skills: Successful implementation requires multidisciplinary expertise. Engineers must understand sensor science and construction processes; data engineers handle pipeline and cloud platform setup; data scientists design analytics models; IT staff manage network and security; and QA/QC managers interpret results to guide field actions.
FAQs
How does a predictive QA/QC system improve over manual inspections?
It adds real-time sensor data and analytics to QA. Instead of waiting for periodic walk-throughs, the system continuously monitors parameters and flags issues immediately. This means defects can be caught and fixed early, improving consistency and reducing schedule delays.
What types of sensors or data are typically used in a QA/QC system architecture?
Common inputs include geometric scans (LIDAR/3D photogrammetry), environmental sensors (temperature, humidity), structural sensors (strain, vibration), imaging (cameras, infrared), and location trackers (GPS/RFID). The choice depends on the quality parameter (e.g. concrete curing vs. alignment).
Which industries or projects see the most benefit from predictive QA/QC?
Heavy civil infrastructure (roads, bridges, tunnels, dams) and large facilities (industrial plants, power stations) benefit greatly due to scale and risk. Transportation networks (rail, highways), utilities (water, energy), and prefabricated construction also gain efficiency and safety improvements from automated QA/QC systems.
Is it true that predictive QA/QC eliminates all quality defects?
No system can eliminate defects completely, but predictive QA/QC greatly reduces them. By catching anomalies early, it minimizes the chance of unnoticed issues. Human oversight is still needed for judgment and handling novel edge cases, but data-driven alerts make quality control far more reliable than manual processes alone.
Conclusion
Predictive QA/QC system architectures bring high-value automation to construction quality management. By embedding sensors and analytics into workflows, teams gain continuous insight into workmanship, making QA/QC proactive rather than punitive. This leads to earlier issue detection, tighter specification adherence, and reduced rework and costs. For technical teams, embracing such systems means integrating IoT sensors with digital models and analytical engines, which together provide the confidence that each project element meets safety and design standards.
In the era of data-driven infrastructure, a well-designed QA/QC system is becoming essential: it boosts project efficiency and profitability today, and lays the foundation for future advances like autonomous inspections. In short, modern QA/QC system architecture is transforming how heavy civil work is monitored and controlled, enabling smarter, more reliable construction outcomes.
Resources:
-
Vitaly Berezka, “How technology is reshaping QA/QC in construction,” Frontier Enterprise, Nov 10, 2025.
-
Toyin, J. O., & Sattineni, A., “Innovative Approaches to QA/QC in Construction: Current State,” Proc. CIB World Building Congress, Purdue Univ., 2025.
-
Bentley Systems (Gijselman et al.), “Harnessing IoT to Transform Heavy Civil Construction,” White Paper, Bentley Systems, 2023.
-
GAO Tek, “Applications of IoT Sensors in Construction,” GAO Technologies, 2023.
-
PlanRadar, “Digital QA/QC in Construction: The Shift from Paper to Platform,” 2025 (GCC Construction QA/QC Impact Report).
For all the pictures: Freepik
Suggested article for reading:
8 Future-Proof Construction AI Applications Every Firm Should Adopt Before 2030
7 AI Tools Changing Construction Estimating & Bidding Right Now
8 Predictive Maintenance KPIs Every Construction Fleet Should Track with AI
5 Steps to Integrate Generative AI with BIM for Faster Design Iterations
9 Ways the Construction Industry Is Adapting with AI in 2026 (From Design to Handover)