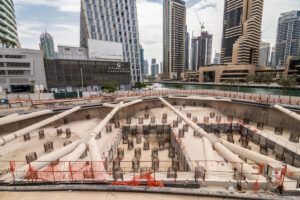
Large infrastructure projects often hide unseen hazards – from design gaps and site anomalies to schedule and cost overruns. Continuous jobsite monitoring uses real-time sensors, cameras, and data feeds to illuminate those blind spots, alerting teams to problems before they snowball. For capital project leaders, this means fewer surprises, less rework, and a faster path to ROI. By integrating live data into executive dashboards, decisions shift from reactive fire-fighting to proactive risk mitigation. This guide offers a high-level framework for adopting continuous monitoring to safeguard heavy civil, energy, and infrastructure programs.
Table of Contents
Hidden Hazards: Why Major Infrastructure and Energy Projects Face Unexpected Risks
Even well-funded projects can be blindsided by latent issues. For example, a recent audit found major UK infrastructure programs averaged 6 years of delay and nearly £2 billion in extra costs due to problems emerging mid-stream. Much of this arises from quality and environmental issues that were invisible during planning. Industry studies note that rework alone can consume roughly 9% of a project’s budget, often because defects were detected too late.
In sensitive sectors like healthcare, unmonitored events can be downright dangerous: one report found that more than half of hospital infections during construction came from hidden dust leaks. Hospitals now deploy 24/7 environmental sensors so that even minor lapses (like a containment breach) immediately trigger alerts. Without continuous data, costly or hazardous conditions – such as hidden structural stress, safety violations, or environmental exposures – often go unnoticed until they force expensive stop-work or retrofits.
Structural Causes Behind Hidden Jobsite Failures in Infrastructure Programs
-
Siloed Information and Data Gaps: Project data is often fragmented across hand-written logs, disconnected spreadsheets, and separate subcontractor reports. No single team sees the full picture. When schedules, quality reports, or safety checks aren’t integrated, small issues slip through the cracks until they become crises.
-
Periodic Inspections vs. Real-Time Reality: Traditional QA/QC relies on scheduled site walks or milestone reviews. In between, real conditions can change (e.g. soil shifts, cracking concrete, water intrusion) without notice. Limited visibility means hazards are detected late.
-
Manual Workflow Variability: Inconsistent processes – such as ad-hoc change orders, field-to-office delays in reporting, or uneven contractor methods – introduce errors. Without digital tracking, one subcontractor’s poor-quality work might not be flagged until later.
-
Misaligned Stakeholder Incentives: Contractors and trade partners may focus on their immediate tasks or interim milestones. If a tradesperson’s scope is complete, they lack incentive to report nearby issues caused by others. Continuous monitoring aligns accountability by making performance transparent.
-
Legacy Mindset and Resistance: Some teams still trust annual reports or expert intuition over sensor data. This cultural gap slows adoption; supervisors may overlook data outputs or defer to past practices, perpetuating blind spots.
Together, these root causes mean hidden jobsite failures – from unreinforced defects to minor safety breaches – persist unless illuminated by continuous oversight.
Suggested article to read: 9 Practical Air-Quality Monitoring Platform Deployment Steps on a Live Jobsite (Sensors, Networks, Dashboards)

Strategic Framework: A Five-Part Executive Model for Continuous Jobsite Monitoring Adoption
-
Align Leadership and Define Objectives: Ensure project sponsors, owners’ reps, and senior PMs agree on the goal of real-time visibility. Assign clear roles (e.g. an Executive Sponsor, a Project Monitoring Lead) and establish metrics for success (safety events, schedule slippage, rework rates). This top-down commitment solves coordination issues and signals that unknown risks are a priority.
-
Map Risks and Baseline Performance: Inventory known risks and high-impact activities (deep excavation, heavy lifts, long-duration outages). Establish baseline KPIs (e.g. days behind schedule, incident counts) so deviations stand out. By explicitly targeting blind-spot areas (like underground utilities or compliance checkpoints), teams know where to apply monitoring.
-
Deploy Sensing and Connectivity Infrastructure: Roll out the tech – IoT sensors (vibration, tilt, environmental), cameras or drones, GPS tracking and wearables – tailored to site conditions. For instance, a highway job might use structural tiltmeters and heavy-equipment trackers; a remote solar farm could add weather and security cameras. Robust onsite networks (cellular, satellite, private LTE) must carry data reliably. This fills visibility gaps: AWS notes that well-placed IoT sensors “offer operational visibility into every corner of the site, monitoring for structural hazards [and] equipment malfunctions”.
-
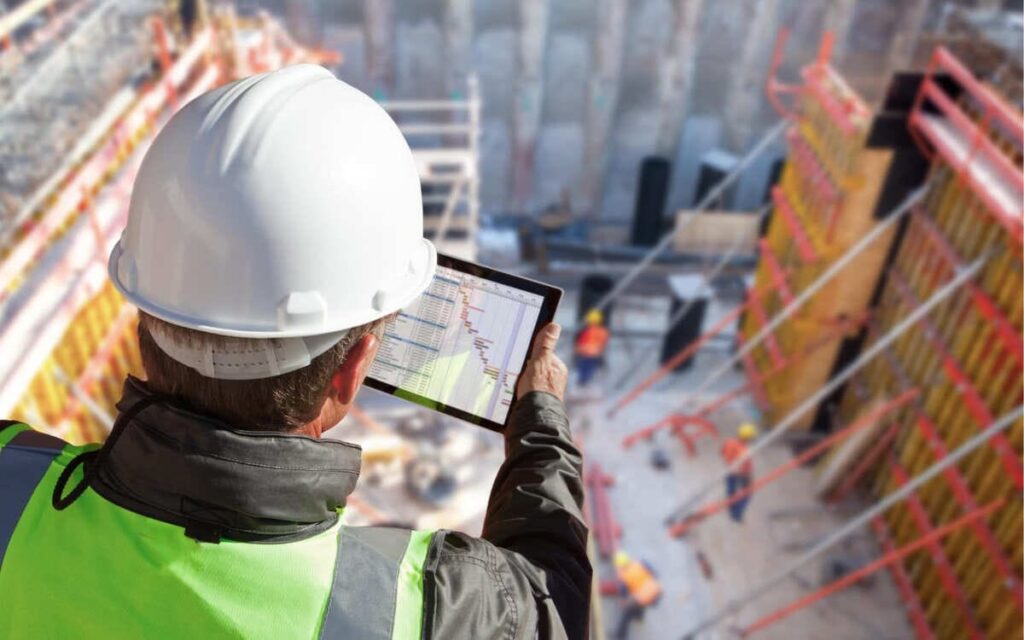
Build Integrated Analytics and Dashboards: Channel all data into a centralized platform with real-time dashboards and alerts. Define which KPIs and thresholds trigger notifications (e.g. concrete curing temperatures, worker proximity to hazards, progress milestones). Analytics – possibly AI-based – should surface patterns (e.g. a crane cycle time creep or moisture level trend) that precede problems. Armed with visual “single pane of glass” reporting, executives and field teams turn raw data into action. For example, structural health monitoring systems now deliver continuous, high-resolution readings so managers can pivot from reactive to predictive maintenance.
-
Engage Contractors and Drive Accountability: Integrate monitoring expectations into contracts and daily workplans. Train field teams on the new tools – from scanning QR codes on equipment to reviewing daily dashboard briefs. Establish protocols for responding to alerts (e.g. stop work if settlement exceeds threshold) so data leads to action. This alignment ensures that everyone plays by the same playbook: when anomalies arise, crews know they must address them rather than paper over issues. Over time, this reduces rework, streamlines change management, and keeps all parties focused on collective outcomes.
Each step of this framework closes oversight gaps. For example, by moving to predictive alerts one company cut emergency repairs by catching beam alignment issues days in advance. The cumulative effect is stronger risk control and faster ROI.
Data-Driven Insights: KPIs, Risk Indicators, and Predictive Signals from Continuous Jobsite Monitoring
Continuous monitoring generates a wealth of data, but executives need clear insights, not data dumps. Key examples include:
-
Safety & Quality KPIs: Monitor on-site incidents, near-misses, PPE compliance breaches, or defect rates. For instance, wearable fall sensors or AI-based camera feeds can flag safety lapses in real time. Tracking these trends can show if safety is improving (e.g. fewer fall alerts) as monitoring is adopted. Similarly, tracking quality indicators like the percentage of grade checks passed first-time or number of NCRs per week helps spot workmanship issues early.
-
Schedule and Productivity Metrics: Compare planned vs. actual progress daily. Automated takeoff from drone imagery or RFID-tagged material deliveries can quantify productivity. A sudden drop in work output or late material arrivals triggers a review. For example, if a tunnel excavation’s advance rate starts falling behind historical patterns, teams can intervene (pump more concrete, add shifts) before delays compound.
-
Environmental and Asset Health Signals: Install environmental sensors (air quality, noise, vibration, weather) and equipment IoT (fuel use, engine health). These act as early warnings. A bridge project with continuous tiltmeters could see a gradual shift under heavy loads – and adjust shoring before any crack appears. Likewise, construction dust monitors in healthcare builds have detected containment breaches within minutes, enabling containment fixes before patient areas are compromised.

-
Predictive Alerts and Anomaly Detection: Use analytics to flag subtle anomalies: slowly growing cracks, rising settlement, or unusual worker accumulation (suggesting a constraint). Continuous streams allow machine-learning models to predict issues (a digital-twin heatmap might forewarn overloaded temporary supports during a heatwave). For example, sensor systems often spot “sub-threshold” signs (like early crack formation or minor tilt) long before visible damage, giving project teams a critical time advantage.
-
Executive Dashboards (“Single Pane of Glass”): Synthesize data into scorecards for leaders. A consolidated view might show overall risk status (green/yellow/red) by category: cost, schedule, safety, quality. Drill-down tools let decision-makers explore anomalies (clicking on a sensor alert to see trend charts). Having data lakes feeding into standard reports helps justify investments: long-term monitoring metrics even bolster budgeting with evidence-based forecasts.
In practice, this data-driven approach transforms oversight. Executives move from guessing which issues are critical to knowing which “levers” to pull. When combined with clear dashboards, continuous monitoring makes unseen risks visible and manageable, and often yields payback in a few years as traditional firefighting (and its costs) are reduced.
Implementation Roadmap: Phased Rollout of Continuous Jobsite Monitoring in Infrastructure Projects
-
Planning & Pilot Phase: In months 1–6, articulate strategy and secure executive buy-in. Identify a pilot project (e.g. a high-profile transit build or energy site) to trial the system. Assign roles (Executive Sponsor, Monitoring Coordinator) and set up basic infrastructure. This pilot tests sensor types, network coverage, and data workflows with a limited scope. Early wins (catching one issue or reducing a short stoppage) build confidence.
-
Scale Deployment: In months 6–18, expand to other projects across the portfolio. Standardize technology stacks (choose common sensor brands, integrate with corporate IT). Align stakeholders: train project teams, update contracts to reference monitoring data. At this stage, integration with existing systems (BIM models, PM software, ERP) is critical so that monitoring data flows into familiar tools. Regular leadership reviews ensure all projects share lessons.
-
Governance & Process Integration: Establish permanent governance (e.g. a Project Controls steering committee) to oversee monitoring metrics and investments. Codify processes (such as automatic alerts to safety teams or weekly risk reviews based on live data). Ensure roles for data analysts or a digital PMO function. During this phase, continuously refine KPIs and calibrate sensor thresholds. Formalizing these practices embeds monitoring in oversight workflows.
-
Continuous Optimization: Beyond initial rollout, schedule regular audits of the system’s performance. Update technology (new sensors, AI tools) as they mature. Revisit training programs to address field feedback and foster adoption. This creates a feedback loop: data from one phase informs improvements in the next. Over time, the roadmap evolves into an ongoing maturity plan, with milestones for deeper integration (e.g. smart contracts triggered by verified sensor data).
Each roadmap phase involves leadership roles and stakeholder alignment. Owners and senior execs champion the vision, PMOs drive execution, IT ensures infrastructure readiness, and contractors contribute by executing with the new processes. By phasing the rollout – pilot first, then scale – teams can manage change without disruption while modernizing oversight.
Leadership Considerations: Managing Data Gaps, Adoption, and Integration in Continuous Monitoring
-
Data Reliability and Overload: Continuous sensors generate large volumes of information. Executives must recognize that high-resolution data can produce “false positives” or noise if not managed. Platform investments (such as machine-learning analytics and GIS-overlay dashboards) are needed to filter alerts and contextualize data. Plans should include data governance: who cleans the data, who investigates each alert.
-
Legacy Assets and Technical Constraints: Older infrastructure may lack space or compatibility for new sensors. Integration may require creative solutions (magnetically mounted units, drones for inaccessible areas). Leaders should budget for retrofit challenges and consider pilot testing on less critical systems first.
-
Adoption and Change Management: Shifting to continuous monitoring demands cultural change. Field crews may fear micromanagement, and executives may mistrust algorithmic alerts. Clear communication is essential: emphasize that data supports (not replaces) human judgment. Offer training so teams understand devices (e.g. how tiltmeters work) and dashboards. Incentivize use by tying performance reviews or subcontractor bonuses to quality metrics revealed by monitoring.

-
Interoperability and Tech Investment: Many organizations face a patchwork of legacy tools. Introducing new monitoring platforms risks silos if they don’t “talk” to existing systems. IT must plan for APIs or middleware that feed sensor data into project management or maintenance software. Engagement with technology partners early on avoids expensive rip-and-replace later.
-
Phasing and ROI Pressure: A staged deployment means some projects will see benefits before others. Leaders need patience and clear ROI models. Highlight quick wins (e.g. one project’s defect avoided) to justify further spend. In practice, careful rollout focusing on high-impact areas delivers early savings that justify broader adoption.
-
Privacy and Compliance Risks: Real-time monitoring (e.g. wearable trackers or cameras) raises worker privacy and regulatory concerns. Leaders must ensure policies are in place (such as limiting video review to safety officers) and that data storage complies with labor laws and cybersecurity standards. Transparent governance here avoids resistance.
By acknowledging these constraints, executives can address them upfront. Data limitations and integration hurdles are real, but with phased planning and clear accountabilities, monitoring adoption becomes manageable. Balanced leadership means weighing these risks against the substantial improvements in oversight and risk control that continuous monitoring provides.
FAQs
How does continuous jobsite monitoring detect hidden project risks?
Continuous monitoring uses sensors and devices (drones, cameras, wearables) to stream real-time data about the construction site. Analytics flag anomalies – for example, a sudden ground tilt, a spike in noise or dust levels, or an equipment fault – that wouldn’t be visible during routine inspections. When an alert is triggered (say, an unexpected vibration), project teams investigate immediately. This ongoing visibility means issues are caught in minutes or hours instead of weeks or months.
What kinds of technologies are commonly used in continuous jobsite monitoring?
Modern monitoring leverages IoT and cloud tools. Typical hardware includes structural sensors (strain gauges, accelerometers, tiltmeters), environmental sensors (dust, gas, weather), CCTV cameras, drones for aerial imaging, and GPS tags on equipment. These feed data into software platforms. Advanced systems may use AI-powered video analytics to spot safety violations or machine-learning models to predict component fatigue. All data is usually integrated in a cloud dashboard so that executives and site managers can review key indicators on demand.
Which types of projects benefit the most from continuous monitoring?
High-value, high-risk projects see the fastest gains. Examples include heavy civil and transportation (bridges, tunnels, highways), large utilities and energy installations (power plants, grid expansion), and complex industrial facilities (refineries, data centers). Sensitive sectors like healthcare or cleanrooms also use it (to prevent contamination during construction). Essentially, any project where failures are very costly – either financially or in human risk – can benefit. Continuous monitoring scales with project size: the bigger or more complex the scope, the higher the value of early warnings.
Is it true that continuous monitoring can eliminate all project surprises?
No technology can eliminate 100% of surprises, but continuous monitoring dramatically reduces them. By providing ongoing data, it catches the vast majority of issues early. In practice, companies often see a few years of payback: for instance, sensor-based monitoring has shown ROI in 1.5–3 years for large projects. The goal is not perfection but far better visibility. It means executives know about 80–90% of latent problems before they escalate, which is a major improvement over traditional oversight. In short, continuous monitoring is a game-changer for risk reduction, not a guarantee of perfection.
Conclusion: Embracing Continuous Monitoring for Resilient Project Delivery
Continuous jobsite monitoring represents a paradigm shift: from periodic checks to perpetual oversight. For capital project leaders, the strategic benefit is clear – early detection of hidden threats leads to safer, on-time delivery and measurable ROI. The steps outlined above form a decision-ready roadmap. With clear governance, aligned incentives, and the right technology mix, executives can seal oversight gaps that have long plagued major infrastructure and energy programs.
In the end, data-driven monitoring becomes a foundational asset: it reduces surprises, optimizes resource allocation, and protects investments. By treating sensor networks and real-time data as core to project stewardship (rather than optional add-ons), organizations build resilient delivery systems – where unknown risks are caught early, and project goals are secured.
Resources:
-
Amazon Web Services IoT Blog, “Delivering an integrated approach to safety: How AWS workforce safety solutions make work safer” (July 2024)
-
Enterprise Risk Magazine, “The Hidden Financial Risks of Infrastructure Investments” (June 2025)
-
Encardio Rite Blog, “How Sensor-Based Monitoring Prevents Costly Infrastructure Failures Before They Happen” (2019)
-
Krusinski Construction, “Why Quality Assurance is Critical to Reducing Construction Risk Related to Rework & Defect” (Nov 2024)
-
Beck Technology Blog, “Construction Risk Management Using Digital Technology in the Preconstruction Phase”.
-
Environmental Health & Engineering (EH&E) Blog, “4 Ways 24/7 Construction Monitoring Makes Healthcare Facilities Safer” (Mar 2025)
For all the pictures: Freepik
Suggested article for reading:
8 Future-Proof Construction AI Applications Every Firm Should Adopt Before 2030
7 AI Tools Changing Construction Estimating & Bidding Right Now
8 Predictive Maintenance KPIs Every Construction Fleet Should Track with AI
5 Steps to Integrate Generative AI with BIM for Faster Design Iterations
9 Ways the Construction Industry Is Adapting with AI in 2026 (From Design to Handover)