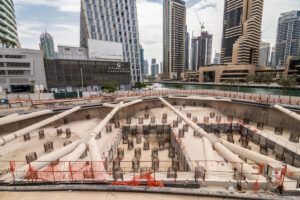
Construction sites are bustling hubs of activity that unfortunately can generate significant air pollution. Dust from demolition, fumes from machinery, and off-gassing from materials all contribute to degraded air quality if not properly managed. To protect workers, comply with regulations, and maintain good community relations, air-quality platform metrics are used to continuously track environmental conditions on-site. By leveraging real-time data on specific pollutants, project managers can take informed actions to minimize health risks and avoid costly shutdowns.
In one city infrastructure project, for instance, deploying an air quality monitoring platform revealed that nighttime excavation was causing fine particulate levels to spike far above safe limits. Armed with 15-minute interval data, the team adjusted work schedules and ramped up dust control measures, cutting PM₂.₅ levels by over 40% within weeks. Without such monitoring, these invisible hazards might have gone unnoticed until complaints or illnesses arose. This example underscores a simple truth: you can’t manage what you don’t measure. The following sections delve into six critical construction-grade air quality metrics and explain why they matter for safer and more sustainable construction operations.
Table of Contents
6 Construction-Grade Air-Quality Platform Metrics (and Why They Matter)
1. PM₂.₅ – Fine Particulate Matter
PM₂.₅ refers to particulate matter with diameters of 2.5 microns or smaller – about 1/30th the width of a human hair. These fine particles are a major byproduct of construction activities such as concrete cutting, drilling, and especially demolition. Because of their tiny size, PM₂.₅ particles can stay suspended in the air and travel long distances beyond the site. More critically, they penetrate deeply into the lungs when inhaled, even reaching the bloodstream.
This can trigger respiratory issues (like asthma attacks, bronchitis) and cardiovascular stress in both workers and nearby residents. In fact, fine particulate pollution is associated with increased hospital admissions and even premature mortality among vulnerable groups such as the elderly and those with pre-existing heart or lung conditions.
Monitoring PM₂.₅ on a construction site provides immediate insight into dust control effectiveness. For example, if real-time sensors show PM₂.₅ spikes during a building teardown, contractors can respond by wetting down debris, adjusting demolition methods, or providing personal protective equipment to workers. Why it matters: fine dust particles are largely invisible but hazardous – continuous measurement is the only reliable way to know if air is safe. Many air-quality regulations set strict limits on PM₂.₅ concentrations, and exceeding these limits can halt projects. By tracking this metric, construction teams can avoid violations and health risks by taking timely mitigation steps.
2. PM₁₀ – Coarse Particulate Matter
PM₁₀ encompasses dust particles up to 10 microns in diameter, including PM₂.₅ and slightly larger particles. Coarse dust is typically generated by activities like excavation, earthmoving, and traffic on unpaved surfaces at construction sites. These particles are larger and heavier than PM₂.₅, so they tend to settle out of the air more quickly and remain closer to the source. However, PM₁₀ is still inhalable and can irritate the nose, throat, and upper lungs. High levels of PM₁₀ cause coughing, sneezing, and can exacerbate conditions like asthma or chronic obstructive pulmonary disease (COPD). Additionally, visible dust clouds from a site create nuisances for neighboring properties, reducing visibility and depositing grime on surfaces.
By monitoring PM₁₀, project managers get a gauge of general dust levels and site cleanliness. It’s common practice to set up perimeter dust monitors to ensure that PM₁₀ leaving the site stays below regulatory thresholds. If monitors detect rising PM₁₀ during a day’s work, measures can be implemented immediately – for instance, increasing the frequency of watering haul roads, using dust suppressants on soil, or adjusting work when wind conditions are unfavorable.
Why it matters: controlling PM₁₀ is not only about health but also about community impact and compliance. Many jurisdictions require dust management plans for construction projects, and real-time PM₁₀ data is key to proving that those plans are effective. Keeping coarse particle levels in check helps maintain good relations with the community and prevents environmental fines or work stoppages due to excessive dust.
Suggested article to read: Air Quality in Construction; 2024 Guide
3. Carbon Monoxide (CO)
Carbon Monoxide is a colorless, odorless gas produced by the incomplete combustion of fuels. On construction sites, the typical sources of CO include diesel generators, gasoline engines (vehicles, compressors), and any gas-powered tools or heaters. In outdoor environments, CO usually disperses, but it can accumulate in confined or partially enclosed areas (for example, inside buildings under construction, basements, or tunnels). CO is dangerous because it binds to hemoglobin in our blood, reducing the blood’s oxygen-carrying capacity. Even moderate concentrations of CO can cause headaches, dizziness, and fatigue – symptoms that imperil worker safety if heavy machinery is being operated. High concentrations can lead to confusion or loss of consciousness, and continued exposure can be fatal.
Tracking carbon monoxide levels with an air quality platform allows early detection of this stealth hazard. Real-world example: consider a crew using gasoline-powered pumps in an underground parking structure. Without CO monitors, they might not realize ventilation is inadequate until workers become sick. With continuous CO monitoring, alarms can trigger if CO nears unsafe levels, prompting an evacuation or increased ventilation before anyone is harmed.
Why it matters: CO is often called the “silent killer” – you cannot see or smell it. In construction settings, where engines and generators are necessary, having a CO metric on your platform is vital for worker health. It also helps ensure compliance with occupational safety regulations, which mandate exposure limits for CO (for instance, many safety standards cap 8-hour workplace CO exposure at 25–50 ppm). Continuous CO data enables the site manager to manage equipment usage or airflow to keep concentrations below these limits at all times.
4. Nitrogen Dioxide (NO₂)
Nitrogen Dioxide is one of the nitrogen oxides (NOₓ) commonly emitted from combustion engines and explosives used in construction. Diesel engines in heavy machinery, trucks, and generators are major NO₂ sources on site. NO₂ is a reddish-brown gas with a sharp odor, but even at levels too low to see or smell, it can irritate the human respiratory tract. Short-term exposure to NO₂ inflames the airways, aggravating asthma and increasing susceptibility to respiratory infections. Over the long term, consistent exposure can contribute to decreased lung function growth in children and other chronic respiratory issues. Environmentally, NO₂ is also significant because it reacts in the atmosphere to form ozone (O₃) and secondary particulate matter, compounding smog problems.

Monitoring NO₂ in real time is important for both health and environmental management. For instance, a busy construction site with many diesel vehicles may observe higher NO₂ levels during peak traffic or material deliveries. If data shows NO₂ spikes, site managers can take action like rotating equipment usage to off-peak times, tuning engines, or using newer machines with better emission controls. Some projects even designate low-emission zones on-site or retrofit older equipment to reduce NOₓ output. Why it matters: regulators often include NO₂ in ambient air quality standards due to its health impacts.
In urban infill construction, nearby residents might be exposed to a dose of NO₂ from site emissions combined with traffic pollution. An air-quality platform tracking NO₂ helps ensure that construction activities do not push local air quality into the “poor” range. It also provides feedback on the effectiveness of strategies like using cleaner fuel or after-treatment systems on diesel engines. Ultimately, managing NO₂ is about minimizing a pollutant that can make it hard to breathe for workers and neighbors alike.
5. Sulfur Dioxide (SO₂)
Sulfur Dioxide is a pungent, toxic gas formed whenever sulfur-containing fuel is burned. In construction, SO₂ emissions might come from diesel equipment if high-sulfur fuel is used, or from on-site processes like asphalt heating, welding with certain rods, or demolition of old facilities that used sulfur-laden fuels. SO₂ is known to irritate the skin and the mucous membranes of the eyes, nose, throat, and lungs. At even modest concentrations, it can provoke coughing, wheezing, and shortness of breath – especially in individuals with asthma or other respiratory conditions. High bursts of SO₂ can lead to intense bronchoconstriction (narrowing of airways), making it dangerous for exposed workers or bystanders.
Including SO₂ as a metric in an air quality monitoring system is particularly important near sensitive sites or when using fuel-burning equipment for extended periods. If monitors detect rising SO₂ levels downwind of a generator or an asphalt kettle, it’s a clear signal to check the fuel quality (e.g., ensure ultra-low sulfur diesel is being used) or improve exhaust filtering.
Why it matters: while many regions have reduced sulfur in fuels drastically (which has lowered routine SO₂ emissions), construction projects that involve activities like underground blasting or remediation of industrial sites could still release sulfur compounds. Moreover, SO₂ contributes to secondary problems such as acid rain and fine sulfate particles in the air. From a compliance standpoint, short-term SO₂ spikes are taken seriously by environmental authorities – exceeding the one-hour or 24-hour SO₂ exposure limits can result in immediate shutdowns. Continual SO₂ data helps a construction team stay within safe operating limits and demonstrate their commitment to using cleaner practices.
6. Volatile Organic Compounds (VOCs)
Volatile Organic Compounds represent a broad category of carbon-based chemicals that evaporate easily at ambient temperatures. Construction sites can release VOCs from multiple sources: paints and solvents, adhesives and sealants, fuel vapors (gasoline, diesel), and even from disturbed contaminated soils on certain redevelopment projects. Some common VOCs encountered include benzene, toluene, xylene, and formaldehyde, among others. Many VOCs have strong odors, but the smell is not the main concern – these chemicals can cause a range of health effects. Short-term exposure to high levels of VOCs can lead to headaches, nausea, eye and throat irritation, and dizziness. Long-term exposure to certain VOCs (like benzene or formaldehyde) is linked to serious issues including liver/kidney damage and increased risk of cancer.

Monitoring total VOC levels provides a safeguard that toxic fumes are not building up on site or seeping into nearby areas. Consider a scenario of applying large volumes of industrial adhesive or paint in an enclosed area; VOC sensors would quickly alert if ventilation needs to be increased to dissipate the vapors. On open-air sites, a sudden spike in VOC readings might indicate a spill of fuel or chemicals that requires immediate cleanup. Why it matters: aside from direct health hazards (some VOCs can incapacitate workers at high concentrations), VOCs are precursors to smog formation. In sunlight, they react with NOₓ to form ground-level ozone – a pollutant harmful to lungs.
Many regions enforce restrictions on VOC emissions, and green building standards often call for using low-VOC materials. An air-quality platform tracking VOCs helps construction managers verify that indoor air in temporary enclosures stays safe for crews and that outdoor emissions remain within environmental limits. It also reinforces sustainable practices by highlighting the benefit of choosing less polluting products and ensuring proper storage and handling of volatile substances on site.
FAQs
How do air-quality monitoring platforms work on construction sites?
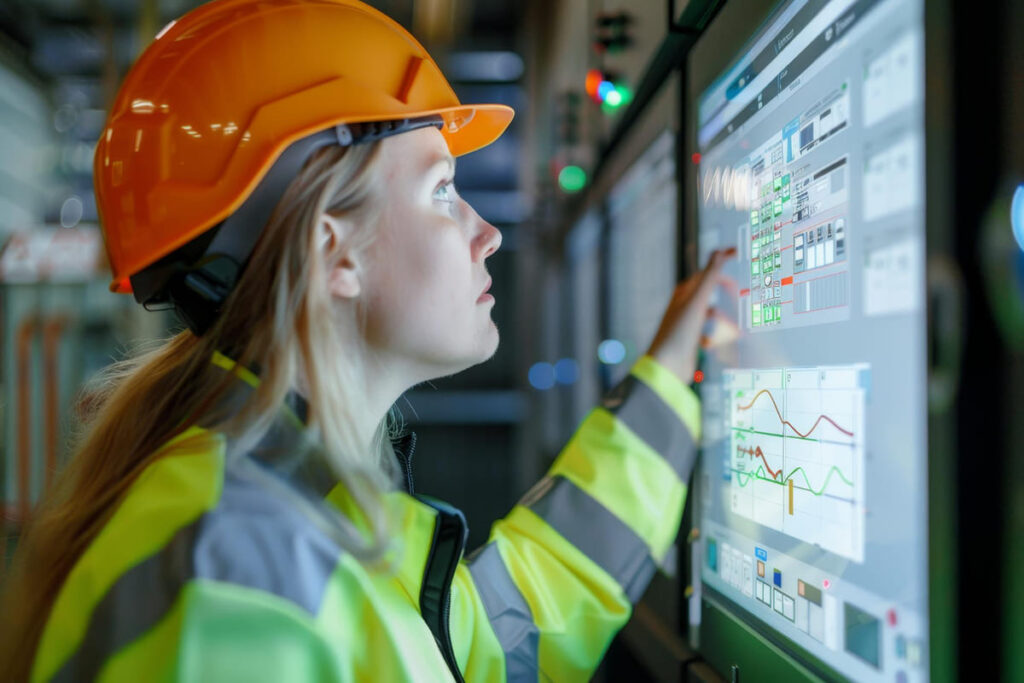
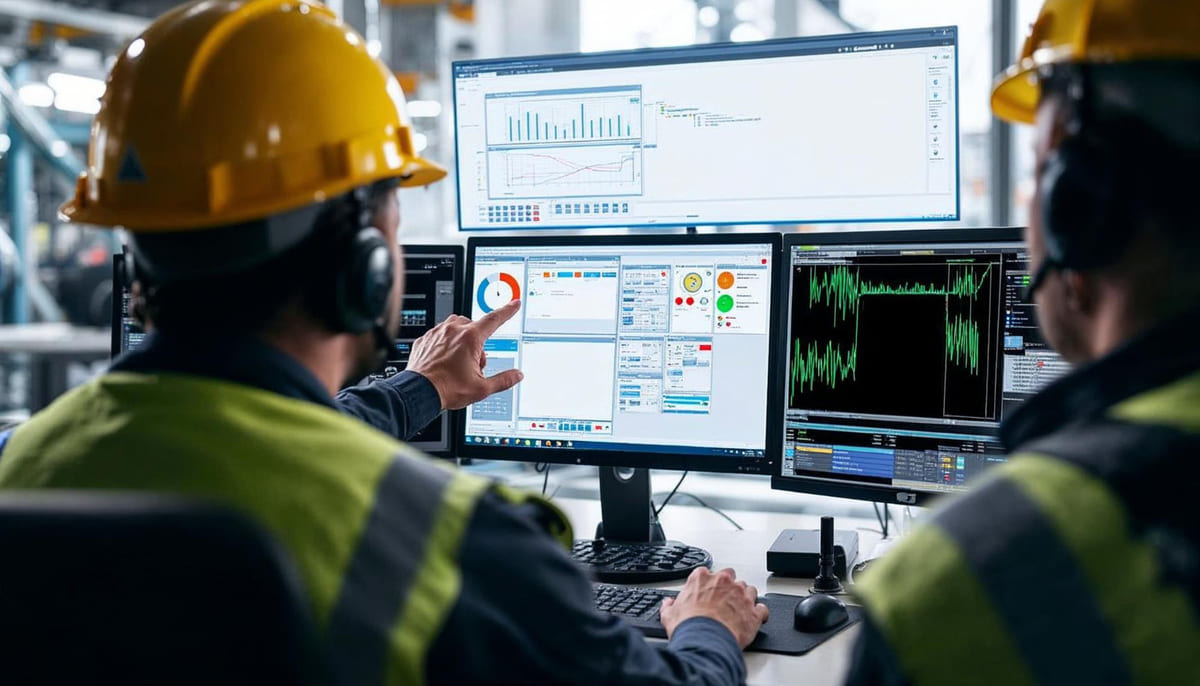
Air-quality monitoring platforms for construction sites typically use an array of electronic sensors placed around the site to measure pollutants in real time. These sensors send data to a central software dashboard (often via wireless transmission) where metrics like dust levels, gas concentrations, and weather conditions are displayed. Site managers can view this live data, set threshold alarms, and receive notifications if any air-quality metric exceeds safe limits. In essence, the platform continuously tracks the site’s air and provides actionable insights (like warning of a dust spike), enabling quick responses to maintain safe conditions.
What air-quality metrics are most important for construction compliance?
The most important air-quality metrics for construction compliance usually include particulate matter (PM₁₀ and PM₂.₅) and volatile organic compounds (VOCs), as these are often regulated in environmental permits. Additionally, projects may need to monitor nitrogen dioxide (NO₂) if heavy diesel equipment is in use, and sometimes sulfur dioxide (SO₂) if high-sulfur fuels or certain processes are involved. Noise and vibration are also monitored on many construction sites (though not air pollutants) for compliance with local ordinances. Ultimately, the required metrics depend on local regulations and the specific activities of the project, but dust and VOC levels are almost universally scrutinized.
Which health risks do construction air pollutants pose to workers?
Construction air pollutants can pose several health risks to workers. Fine dust (PM₂.₅) can penetrate deep into the lungs and even enter the bloodstream, contributing to respiratory illnesses, aggravating asthma, and increasing the risk of heart problems over time. Coarse dust (PM₁₀) can irritate the upper respiratory tract and eyes. Gaseous pollutants like carbon monoxide (CO) can cause headaches, dizziness, or even life-threatening oxygen deprivation in high doses.
Nitrogen dioxide (NO₂) and sulfur dioxide (SO₂) irritate the lungs and can trigger asthma attacks or other breathing difficulties. Volatile organic compounds (VOCs) may cause symptoms such as nausea, headaches, and irritation of the eyes and throat; some VOCs are carcinogenic with long-term exposure. Monitoring and controlling these pollutants helps protect workers from both immediate and chronic health issues.
Is it true that better air quality monitoring can prevent construction delays?
Yes, maintaining good air quality monitoring can help prevent construction delays. By using an air-quality platform to catch issues early – like rising dust levels or toxic gas accumulations – project managers can take swift corrective action (for example, adjusting work practices or deploying dust suppression) before the situation violates regulations or endangers health. This proactive approach means the site is less likely to be shut down by regulators for environmental non-compliance. It also reduces the chances of work stoppages due to safety incidents or community complaints about pollution. In short, real-time monitoring of air-quality metrics keeps the project within legal and safety bounds, which in turn minimizes unexpected interruptions and keeps construction on schedule.
Conclusion
Construction-grade air quality metrics give project stakeholders the visibility they need to keep both people and projects healthy. By continuously measuring key parameters like particulate matter, toxic gases, and vapors, an air-quality platform acts as an early warning system and a performance gauge for mitigation efforts. In practice, these metrics work together: controlling dust (PM₂.₅/PM₁₀) often requires attention to weather conditions, and reducing engine emissions lowers both NO₂ and CO alongside particulates.
Each metric discussed above matters not only for regulatory compliance but also for the overall success of a construction project. When air quality is managed proactively, workers stay healthier and more productive, neighbors experience fewer negative impacts, and the project avoids disruptions like fines or shutdowns. The data from these six metrics ultimately helps create a safer, more responsible construction process – where progress does not come at the expense of clean air.
Resources:
-
California Air Resources Board. (n.d.). Inhalable Particulate Matter and Health (PM₂.₅ and PM₁₀).
-
California Air Resources Board. (n.d.). Carbon Monoxide & Health.
-
California Air Resources Board. (n.d.). Nitrogen Dioxide & Health.
-
California Air Resources Board. (n.d.). Sulfur Dioxide & Health.
-
U.S. Environmental Protection Agency. (n.d.). Volatile Organic Compounds’ Impact on Indoor Air Quality.
-
Specto Technology. (2023). Construction Site Monitoring – Air Quality, Dust, Noise & Weather Solutions.
For all the pictures: Freepik
Suggested article for reading:
Air Quality Monitoring for Construction Sites and Demolition 2025
Indoor Air Quality Monitoring for Hospitals in 2025
9 Proven Concrete Monitoring Platform Benefits Owners See (Faster Stripping, Fewer Breaks, Lower CO₂)
5 Must Have AI Features for Concrete Monitoring (Strength Prediction, Mix Anomaly Alerts, More)