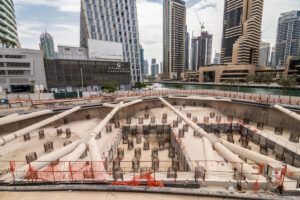
Construction and demolition projects generate substantial airborne pollutants that can affect worker health and the surrounding environment. Dust, particulate matter (PM), volatile organic compounds (VOCs) and combustion fumes are released during tasks such as excavation, demolition, cutting and heavy equipment operation. Air Quality Monitoring for Construction Site is essential for detecting these pollutants in real time.
By continuously measuring air quality, teams ensure that workers are protected, regulatory standards are met, and operations comply with efficiency targets. Early monitoring can quickly reveal problems (for example, a malfunctioning ventilation fan) so corrective actions can be taken before harm occurs.
Table of Contents
Pollutants and Health Risks
Construction sites are often among the largest sources of airborne particulates in urban areas due to heavy machinery and constant material handling. Construction activities emit pollutants such as:
-
Particulate Matter (PM) Fine particles (PM2.5) and coarse dust (PM10) suspended in air. PM comes from demolition, earthworks, crushing and material handling. Fine particles (PM2.5) can penetrate deep into lungs, while coarser PM (PM10) mainly irritates eyes and throat.
-
Respirable Silica Crystalline silica dust from cutting, drilling or grinding concrete, brick, stone or sand. Silica can cause silicosis and lung cancer. OSHA requires on-site silica monitoring and use of dust controls (water sprays, HEPA vacuums) to reduce exposures below legal limits.
-
Asbestos Fibers Fibers from older insulation, flooring, siding or roofing materials can be released during demolition. Asbestos is a carcinogen. EPA regulations mandate a thorough pre-demolition inspection for asbestos-containing materials to prevent fiber release and protect workers.
-
Vehicle Emissions Diesel equipment emits carbon monoxide (CO) and nitrogen oxides (NOx). These fumes degrade local air quality. Monitoring these gases is important, especially near heavy machinery and idling vehicles.
-
Volatile Organic Compounds (VOCs) Solvents, paints, adhesives and other chemicals release VOC gases. Some VOCs (like benzene or formaldehyde) are toxic or carcinogenic. These gases can accumulate in enclosed work areas. Tracking VOC levels (for example with photoionization detectors) helps keep worker exposure in check.
Prolonged exposure to these pollutants can cause respiratory problems, cardiovascular disease and other serious health effects. Identifying and measuring them on-site allows targeted controls to be implemented, keeping workers safe and minimizing impact on the surrounding community.
Suggested article to read: Air Quality in Construction; 2024 Guide
Importance of Air Quality Monitoring
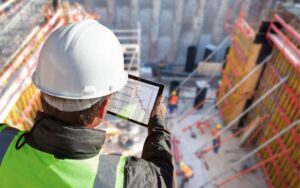
Continuous monitoring provides the data needed to guide dust control and ventilation strategies. Real-time Air Quality Monitoring for Construction Site allows teams to see exactly when and where pollutant levels rise, rather than relying on assumptions. This ensures that dust controls (like water sprays, vacuums, or misting systems) are used effectively and only when needed.
Monitoring also supports compliance with safety regulations and environmental permits. For example, OSHA’s silica standard requires exposure assessment for workers performing certain tasks. A thorough monitoring program documents air quality and alerts managers if action levels are reached. By using monitoring data, construction managers can demonstrate compliance and respond immediately to potential violations, avoiding fines or work stoppages.
Data-driven monitoring often leads to operational efficiencies. Teams can adjust work schedules, equipment usage and control measures based on the data. In one example project, 15-minute sensor data showed that a missed water spray cycle was causing midday dust spikes. By fixing the spray schedule, peak particle levels dropped by over 50% within weeks. This kind of insight, gained only through continuous monitoring, can greatly improve both safety and project efficiency.
Planning an Air Quality Monitoring Program
A systematic plan ensures meaningful results:
-
Define Objectives Decide which pollutants to track (e.g. PM, silica, VOCs) and why (worker safety, compliance, environmental impact). Set alert levels based on regulations or company safety targets.
-
Site Assessment Survey the site layout: mark demolition zones, material stockpiles, and heavy-equipment areas. Note prevailing winds and nearby sensitive locations (schools, hospitals, etc.). This mapping guides optimal sensor placement to capture representative conditions.
-
Select Monitoring Equipment Choose monitors appropriate for the target pollutants. For example, use high-quality optical dust monitors for PM2.5/PM10 and electrochemical or infrared sensors for CO/NOx. Decide between fixed stations, portable units, or personal wearable devices based on site size, budget and mobility needs.
-
Sensor Placement Install sensors at breathing height (about 1.5–2 m above ground) and in locations representative of worker exposure. Place some monitors near emission sources (such as a demolition pit) and others at site boundaries or off-site to catch any drift. Avoid placing sensors too close to isolated non-site sources or obstacles that block air flow.
-
Sampling Frequency Use continuous logging (1–15 minute intervals) to capture spikes and trends. For formal compliance checks, supplement with multi-hour gravimetric filter samples if required by regulations. Real-time data with alarms lets you respond immediately to problems, while daily or weekly summaries provide documentation for reporting and planning.
Clear planning prevents missing critical data and ensures the monitoring program yields actionable information.
Monitoring Technologies
Common technologies for construction air monitoring include:
-
Fixed Air Quality Stations Permanent or semi-permanent units that continuously sample air for dust and gases. Fixed stations often have dedicated power and communications. They provide ongoing data streams from key site areas (for example, adjacent to heavy work zones or material storage).
-
Portable Monitors Handheld or transportable instruments that measure PM2.5, PM10 or specific gases. Portable units allow quick spot checks around the site, for example to verify a problem area or survey changes. They are useful for short-term operations or to supplement fixed stations.

-
Sensor Networks Networks of low-cost sensors can cover a wide area of the site. These wireless nodes send data to a central system or cloud. Studies have shown that networks of inexpensive sensors can identify dust hotspots across large projects, offering higher spatial resolution than a few traditional monitors.
-
Personal Exposure Monitors Wearable devices worn by workers to record individual exposure to dust or fumes. They track concentration over a shift and can reveal which tasks or locations pose the highest risk. Personal monitors complement area monitors by focusing on the worker’s breathing zone.
-
Meteorological Sensors Instruments for wind speed, wind direction, temperature and humidity. Weather data help interpret air quality readings: for example, knowing the wind direction at the time of a dust spike confirms if the source was on-site or off-site.
Modern monitoring systems often integrate all sensor data into cloud-based dashboards. Project managers can view live pollutant levels and set up alarms (e.g. text or email alerts) when thresholds are exceeded. This real-time visibility turns raw numbers into a powerful management tool on the jobsite.
Using Data to Control Dust
Data from air monitors should feed directly into control decisions. Key uses include:
-
Real-Time Alerts Pre-set pollution thresholds trigger alarms when exceeded. For example, if a monitor detects PM2.5 above a safe level, an alert can prompt immediate mitigation (e.g. starting extra water sprays or pausing dusty work). Automated alerts ensure no spike goes unnoticed.
-
Operation Adjustments Monitoring data reveals patterns and problem tasks. If an activity (like crushing, drilling or demolition) consistently pushes dust beyond limits, managers can change the process, timing or add extra controls during that task. In one project, data showed midday dust surges, so crews scheduled additional misting at that time and avoided the exceedance.
-
Verification of Controls After installing a dust control measure (such as a new filter, enclosure, or dust curtain), monitors verify its effectiveness. If the data shows a drop in particle counts after the change, the team knows it works. If not, further adjustments can be tested. This feedback loop optimizes use of resources.
-
Reporting and Record-Keeping Continuous logs and summary reports demonstrate compliance. Detailed records of pollutant levels and mitigation actions can be provided to regulators or clients to prove that the site is meeting air quality requirements. Proactive monitoring actions and data logs are valuable during inspections and audits.
-
Worker Training Data can motivate safe behavior among crews. Showing workers graphs or alerts of dust levels during certain tasks makes hazards tangible. For example, training might highlight how leaving dirt roads unwatered correlates with high dust spikes. When workers see the data, safety rules (like wearing masks or wetting surfaces) become more understandable.
By turning air quality data into action, teams achieve continuous improvement. Combining monitoring with aggressive dust suppression leads to consistently cleaner and healthier construction sites in practice.
Case Study: Data-Driven Dust Control
In one hospital renovation, crews set up real-time PM monitors around a demolition area. The data revealed a hidden problem: dust from rebar cutting in one corner was spiking PM10 above 100 µg/m³ during each cut. Using that insight, the team added extra water sprays whenever cutting occurred in that spot. Within two weeks, peak dust levels fell by 60%. This example illustrates how Air Quality Monitoring for Construction Site can reveal hidden issues and guide rapid improvements in dust control.

Best Practices and Future Trends
Use these best practices for monitoring programs:
-
Start Early Integrate monitoring from project kickoff. Early baseline data can identify clean-site conditions and catch equipment issues before major work begins.
-
Ensure Sensor Maintenance Regularly clean and calibrate all instruments. In dusty environments, clogged inlets or dead batteries will skew data. Follow manufacturer schedules to keep monitors working accurately.
-
Engage Stakeholders Keep workers, managers, and neighbors informed about air quality. Displaying real-time dashboards on-site or sharing summary reports with nearby communities builds trust and shows that the project is proactively managing dust.
-
Leverage Analytics Use data analytics tools to spot trends and predict problems. Some software can combine weather forecasts with historical data to anticipate when pollution may rise (e.g. during stagnant weather). Advanced alerts let teams preemptively adjust operations (like pausing work on a high-pollution day).
-
Plan Data Management Large projects generate large datasets. Use an air quality management platform that filters and graphs results. Dashboards should highlight any threshold exceedances so managers can act without sifting through raw numbers.
Looking ahead, air monitoring is becoming integrated into overall construction management. For example, sensor data might tie into scheduling software or site 3D models (BIM) to optimize the timing and location of work. Regulators in many regions are moving toward requiring continuous site-wide monitoring. For instance, a 2025 mandate in Mumbai requires all major construction projects to report real-time dust levels. By adopting these strategies and technologies now, construction teams stay ahead of regulations and improve project sustainability.
FAQs
How can construction sites effectively monitor air quality?
Construction sites typically deploy a mix of fixed and portable air quality sensors. Fixed monitors are placed near work zones and site boundaries to continuously measure dust (PM) and gases. Portable and wearable monitors allow spot checks and personal exposure tracking. Data is often collected via wireless networks for real-time viewing. By setting alert levels on these monitors, managers can respond quickly if pollution levels rise during operations.
What types of pollutants are measured on construction sites?
The most common pollutants monitored are particulate matter (PM2.5 and PM10), crystalline silica dust, and emissions from diesel engines (CO, NOx). Volatile organic compounds (VOCs) may also be measured if paints or solvents are used. The choice of monitors depends on project activities. For example, demolition work will emphasize silica and asbestos monitoring, while new construction may focus on diesel exhaust and VOCs.
Which monitoring technologies are best for demolition sites?
Demolition sites often use high-accuracy continuous particulate monitors (CAMs) for real-time PM2.5/PM10 data. Fixed stations with data logging are common, along with portable samplers for spot checks. Drones equipped with particle sensors can survey areas of debris. Meteorological sensors (wind, humidity) help understand dust dispersion. Combining these tools ensures the demolition’s air emissions are closely tracked.
Is it true that regulations require air quality monitoring on construction sites?
Regulations vary by location. OSHA mandates monitoring for silica when construction activities could exceed exposure limits. Some cities or countries now require continuous dust monitoring and public reporting on major construction projects. Even where not explicitly required, monitoring is considered a best practice. It demonstrates compliance with worker safety and environmental laws, and it helps avoid fines or community complaints.
Conclusion
Air Quality Monitoring for Construction Site has become a critical component of modern construction management. This article reviewed the common airborne hazards on construction and demolition sites, and described how to implement a robust monitoring program. By using real-time sensors and data analysis, teams can immediately address dust and fume sources, protect worker health, and ensure regulatory compliance. With ongoing advances in sensor technology and data tools, air monitoring will continue to enhance safety and efficiency in construction projects.
Resources:
Association of Equipment Manufacturers (AEM-CEMA). (2025). Best Practices for Managing Construction Site Dust and Emissions.
University of Birmingham. (2023). Construction sites can pinpoint pollution with low-cost sensing tech, new study.
Aurassure. (2025). Dust Monitoring At Construction Sites – A Guide To Better AQI.
U.S. Environmental Protection Agency. (2023). Asbestos-Containing Materials (ACM) and Demolition.
U.S. Environmental Protection Agency. (2022). A Guide to Siting and Installing Air Sensors.
For all the pictures: Freepik
Suggested article for reading:
Top 6 Sustainable Material Handling Practices Driving Green Construction
8 Biggest Material Handling Challenges in Construction and How to Overcome Them
12 Jobsite Material-Handling KPIs to Track Before They Blow Your Schedule
7 Material Handling Breakthroughs in Construction for 2025 (Electric Telehandlers, Smart Cranes, AMRs)
6 Exoskeleton Wins That Reduce Material-Handling Injuries on Site