Urban Air Quality Monitoring is the process of using networks of sensors and data systems to track levels of airborne pollutants in cities. Modern urban areas face air pollution challenges from vehicles, industry, construction, and other sources. Monitoring systems provide real-time data on key pollutants (for example, particulate matter, nitrogen oxides, ozone, etc.) and environmental conditions. This information helps city planners, environmental agencies, and the public understand pollution trends and respond quickly to problem areas.
Table of Contents
Overview of Urban Air Quality Monitoring
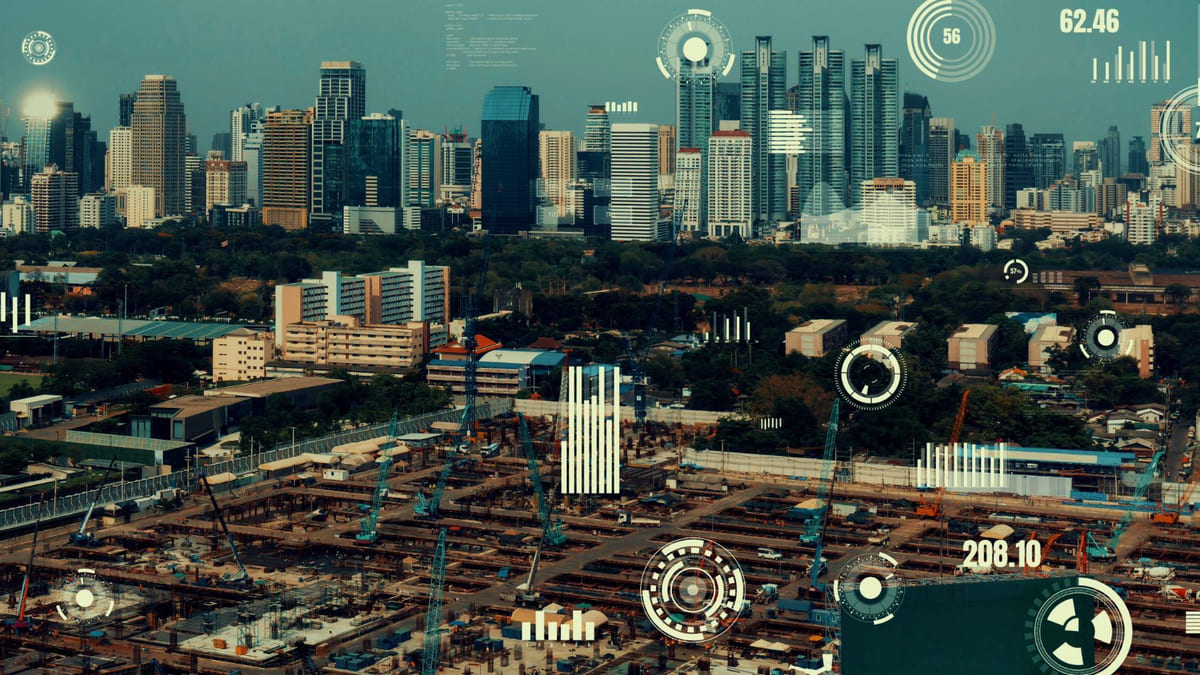
Smart cities leverage the Internet of Things (IoT) to deploy dense sensor networks, increasing coverage beyond what a few regulatory stations can provide. By 2025, advances in low-cost sensors, wireless connectivity, and data analytics have made it practical to gather detailed air quality metrics at neighborhood scale. Sensor data is integrated with weather, traffic and infrastructure information on digital platforms. This integration enables immediate insights and predictive analytics. For example, machine-learning models can forecast pollution spikes by combining sensor data with weather and traffic patterns, allowing officials to issue timely health advisories.
Key pollutants and metrics
-
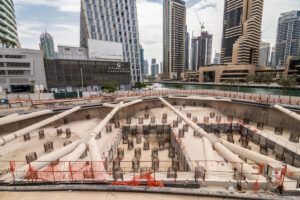
Particulate Matter (PM2.5 and PM10) – Tiny particles from combustion, dust, and construction. High PM levels can aggravate respiratory and cardiovascular illness.
-
Nitrogen Dioxide (NO2) – Emitted from vehicle exhaust and power plants; linked to lung inflammation.
-
Ozone (O3) – A secondary pollutant formed in sunlight from other emissions; harmful at ground level.
-
Carbon Monoxide (CO) – From incomplete combustion (vehicles, heating); dangerous at high concentrations.
-
Volatile Organic Compounds (VOCs) – Organic gases from industrial and vehicular emissions, contributing to smog and health risks.
-
Meteorological data – Temperature, humidity, wind and other weather data used to interpret pollutant dispersion and sensor readings.
Tracking these pollutants continuously and at high resolution provides a clear picture of city air quality. Over time, the data build a long-term record that shows how interventions (like cleaner transit or construction regulations) improve air quality.

Suggested article to read: City Information Modeling (CIM); Ultimate Guide 2024
Sensor Technologies and Deployment
Urban air quality sensor networks use different measurement techniques and deployment strategies. Sensor devices range from low-cost consumer modules to precision government instruments. Common sensor methods include:
Sensor types
-
Optical (laser scattering) particle sensors – Measure airborne particulates (PM2.5, PM10) by shining a laser and detecting scattered light. These detect dust, smoke or soot at fine resolution.
-
Electrochemical gas sensors – Detect gases (NO2, CO, O3) via chemical reactions that produce an electrical signal. These are relatively inexpensive but require frequent calibration and can drift over time.
-
Infrared (NDIR) gas sensors – Used for gases like CO2 or CO by measuring how much infrared light a gas absorbs. NDIR sensors are accurate for greenhouse gases but are more power-hungry and costly.
-
Metal-oxide semiconductor sensors – Sense VOCs and ozone by changes in electrical resistance. They are low-cost but sensitive to humidity and need algorithmic calibration.
Each sensor often includes supporting components like microcontrollers, memory, power regulation, and possibly solar panels. Outdoor units are housed in weatherproof enclosures and sometimes include temperature and humidity sensors to help interpret the readings.
Connectivity and deployment
-
Cellular (3G/4G/5G or NB-IoT) – Uses mobile networks for data transmission. Provides wide coverage in cities but involves a service cost per device.
-
LoRaWAN and other LPWANs – Low-power, long-range networks (sometimes city-run). Allow many battery-powered sensors to send small data packets over kilometers. Used in public or private city networks.
-
Wi-Fi / Ethernet – Used for fixed stations or nodes where power and network infrastructure exist (for example, on buildings or streetlights). Offers high bandwidth for complex sensors.
-
Mesh or proprietary RF networks – Some systems form local mesh networks (Zigbee, 6LoWPAN) between sensors, though range is shorter. Useful for clusters of devices in one area.
Sensors are typically mounted on streetlights, utility poles, or building roofs to represent street-level exposure. Mobile platforms (mounted on buses, bikes or drones) are also emerging to supplement fixed locations. Deployment planning ensures that key areas (schools, major roads, industrial zones) are covered without large blind spots.
Data Integration and Analytics
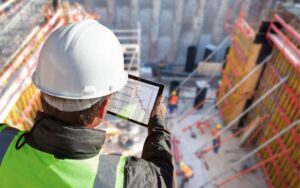
Collected sensor data is aggregated into city-wide data platforms or “urban observatories.” These systems standardize diverse data streams, manage metadata, and apply quality control to each sensor’s output. Real-time dashboards and public portals visualize pollutant concentrations on interactive maps and charts, making the information accessible to managers and citizens.
Advanced analytics and modeling are applied to the integrated data. For example:
Analytics capabilities
-
Data fusion – Combining sensor readings with weather, traffic and city infrastructure data to create high-resolution pollution maps. This lets cities see how factors like traffic patterns affect local air.
-
Predictive forecasting – Machine-learning models learn from historical data to predict future pollution levels or identify expected pollution peaks. Foreknowledge allows proactive measures (for instance, scheduling restrictions before a forecasted smog event).
-
Alerts and automation – Systems can trigger automatic alerts or actions when pollutant thresholds are exceeded. For example, traffic signals might be adjusted to reduce congestion on a high-pollution route, or an automated alert can notify hospitals about rising pollution.
Some cities are building digital twins, which are virtual city models that mirror real-time conditions. In these simulations, planners can test scenarios (like adding a bike lane or electric buses) to see their effect on urban air quality before implementing them.
Applications and Case Studies
Urban air quality monitoring supports many practical applications. Real-time data can trigger health advisories (such as keeping children indoors on high-smog days) and guide traffic management (for example, rerouting vehicles away from pollution hotspots). Policymakers use the data to evaluate regulations (such as low-emission zones or construction limits) and to plan longer-term strategies. The insights empower targeted interventions; for instance, if sensors detect a local pollution spike, officials can investigate nearby sources immediately.
Example city deployments
-
Yerevan, Armenia – The city installed around 170 solar-powered particulate monitors focused on construction sites and busy roads (2022–2024). The network provides continuous dust (PM2.5) readings so regulators can enforce emissions limits on-site. When high levels are detected, the data platform immediately identifies the location, enabling quick action (for example, requiring dust controls at a building site). This system has improved compliance and raised public awareness of local air quality issues.
-
Warsaw, Poland – In 2022, Warsaw deployed 165 air monitors, creating one of Europe’s densest networks. The devices measure particulate matter (PM1, PM2.5, PM10) and gases (NO2, O3) in real time. City analysts use the detailed data to identify pollution hotspots and inform actions like dynamic traffic restrictions or targeted street cleaning. For instance, optimized evening street sweeping in certain areas reduced PM10 spikes by about 20%.
-
Las Condes, Chile – Starting in 2018, the Las Condes district built an integrated IoT network. Over 17,000 streetlights are equipped with smart controllers, and more than 300 sensors monitor outdoor air quality (along with temperature and noise). All device data feed into a centralized management system. This unified infrastructure helped Las Condes both reduce energy use (by smarter lighting control) and continuously monitor pollution trends. Key environmental data are published on a public portal so citizens stay informed.
-
Beijing, China – Facing severe smog, Beijing established a very high-density monitoring grid. By 2017, over 1,000 PM2.5 sensors were deployed citywide, supplemented by satellite and LIDAR measurements. The dense data stream pinpointed the worst pollution sources (industrial zones and congested roads). Combined with policies like low-emission zones, coal plant closures and driving restrictions on bad-air days, Beijing achieved a dramatic drop in winter PM2.5 levels over the last decade.
These real-world cases show how urban air quality monitoring can reveal hidden pollution patterns and guide effective responses. For example, a city might discover that a single busy intersection causes local NO2 spikes, then redesign traffic flow to improve air quality.
Challenges and Future Directions
While modern monitoring systems offer great benefits, several challenges remain:
Key challenges
-
Calibration and data quality – Low-cost sensors can be less accurate than official stations. Their sensitivity may change with humidity or over time. Cities must routinely calibrate sensors against reference monitors and filter out erroneous readings.
-
Network maintenance and cost – Large-scale deployments require reliable power (solar panels or battery changes) and connectivity. Maintaining hundreds of devices (for example, cleaning sensors or replacing damaged units) demands ongoing resources.
-
Data management – Collecting high-frequency data from thousands of sensors produces massive data streams. Cities need scalable platforms and analytics tools to store, process and visualize this data. Ensuring interoperability across devices and handling data security are also concerns.
-
Community engagement – Although air quality data is environmental (not personal), sensor placement in neighborhoods can raise concerns. Transparent data policies, open-access dashboards and citizen involvement (such as public workshops or mobile apps) help build trust in the monitoring program.
Future trends
-
AI and on-device computing – Emerging sensors incorporate edge computing: on-board algorithms can self-calibrate sensors and detect anomalies in real time. Artificial intelligence will further improve data accuracy and reduce the need for manual calibration.
-
Mobile monitoring – In addition to fixed stations, drones and mobile sensors (mounted on buses, bikes or cars) will fill coverage gaps. These mobile platforms can map pollution in areas not served by permanent monitors.
-
Integrated urban management – Air quality systems will tie into other smart city domains. For example, live pollution data might automatically adjust traffic signals or building ventilation systems to optimize both air quality and energy use.
-
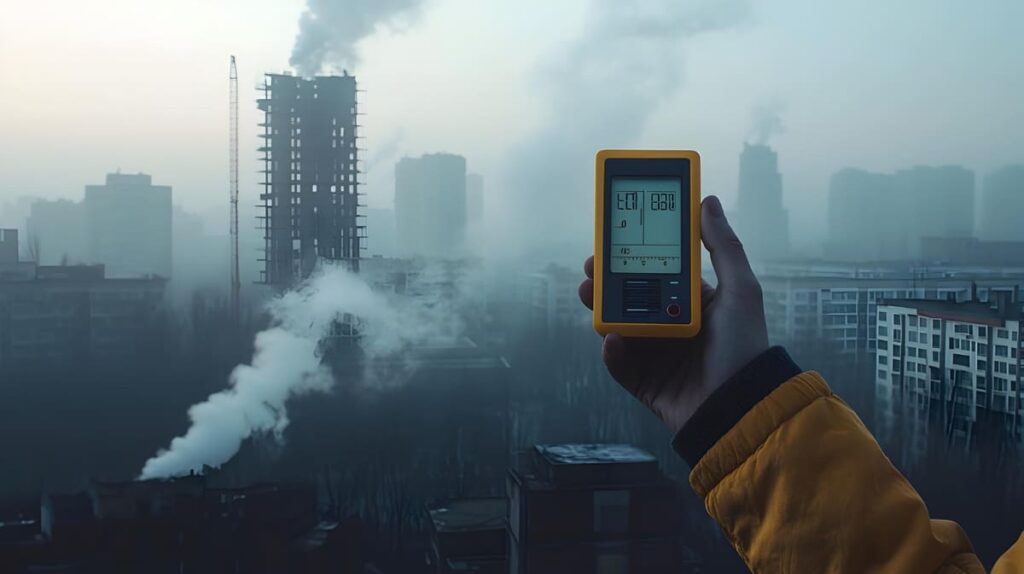
Citizen science and crowdsourcing – Affordable personal air sensors and smartphone apps will involve residents directly. Crowdsourced data can enhance official networks and raise awareness, though it requires quality control before use in policy.
As technology advances, urban air monitoring will become more automated, widespread and integrated. The goal is a seamless system where sensor networks, data analytics and city services work together to protect public health without creating unintended trade-offs (for instance, managing traffic while also ensuring smooth transit).
FAQs
How does urban air quality monitoring work?
Urban air quality monitoring uses networks of sensors placed around a city to measure pollutants continuously. Data from these sensors is sent to a central platform (often via IoT networks) where it is processed. Decision-makers and the public can then see pollution maps or alerts in real time, enabling quick actions like issuing health advisories or adjusting traffic flows to reduce emissions.
What technology is used in smart city air quality monitoring?
Smart cities use a combination of hardware and software. Sensors (optical particle counters, gas sensors, etc.) detect pollutants, and IoT connectivity (cellular, LoRaWAN, Wi-Fi) transmits the data to cloud servers. Software tools include data platforms, analytics dashboards and AI models that process the incoming data. The result is a real-time dashboard and automated alerts that city managers use for informed decision-making.
Which pollutants are tracked by urban sensors?
Common urban pollutants include particulate matter (PM2.5 and PM10) – tiny particles from combustion and dust – as well as gases like nitrogen dioxide (NO2), ozone (O3), carbon monoxide (CO) and often volatile organic compounds (VOCs). Some networks also measure carbon dioxide (CO2) and greenhouse gases. Many sensors also record temperature and humidity, which help interpret the pollution data in context.
Is it true that smart city air quality monitoring improves public health?
Yes. The monitoring itself does not clean the air, but it provides data that enables better health outcomes. By revealing pollution hotspots and trends, the system lets cities target interventions (such as reducing traffic in certain areas or enforcing emissions limits on factories) more effectively. Over time, this leads to lower pollution exposure for residents, fewer health advisories, and improved long-term planning for cleaner air.
Conclusion
Urban air quality monitoring combines networks of smart sensors, IoT connectivity and data analytics to give cities continuous insight into pollution levels. In smart cities, these systems have become critical infrastructure, enabling timely actions (traffic control, building management, public alerts) that protect health and improve sustainability. Real-world deployments from Yerevan to Beijing illustrate how dense sensor networks reveal pollution patterns and guide effective interventions.
The technology is evolving: better sensors, machine learning, and integrated platforms are making monitoring more accurate and actionable. At the same time, cities must balance environmental goals with mobility and livability, avoiding unintended consequences. In 2025 and beyond, urban air quality monitoring remains a key part of the smart city toolkit for achieving cleaner, healthier urban environments.
Resources:
Frontiersin. Cowell, N.H., Chapman, L., Topping, D., et al. (2025). Moving from monitoring to real-time interventions for air quality: Are low-cost sensor networks ready to support urban digital twins? Frontiers in Sustainable Cities.
Paradox Engineering. (2018). Las Condes – Chile.
Envirotech Online. (2022). New air quality monitoring contracts in Birmingham and Warsaw to address air pollution.
Clarity. (2024). Yerevan’s citywide deployment of Node-S air quality sensors for construction-related monitoring.
US Environmental Protection Agency (EPA). (2021). Low–Cost Air Pollution Monitors and Indoor Air Quality.
World Health Organization. (2021). WHO global air quality guidelines: particulate matter (PM2.5 and PM10), ozone, nitrogen dioxide, sulfur dioxide and carbon monoxide.
For all the pictures: Freepik
Suggested article for reading:
Top 6 Sustainable Material Handling Practices Driving Green Construction
8 Biggest Material Handling Challenges in Construction and How to Overcome Them
12 Jobsite Material-Handling KPIs to Track Before They Blow Your Schedule
7 Material Handling Breakthroughs in Construction for 2025 (Electric Telehandlers, Smart Cranes, AMRs)
6 Exoskeleton Wins That Reduce Material-Handling Injuries on Site